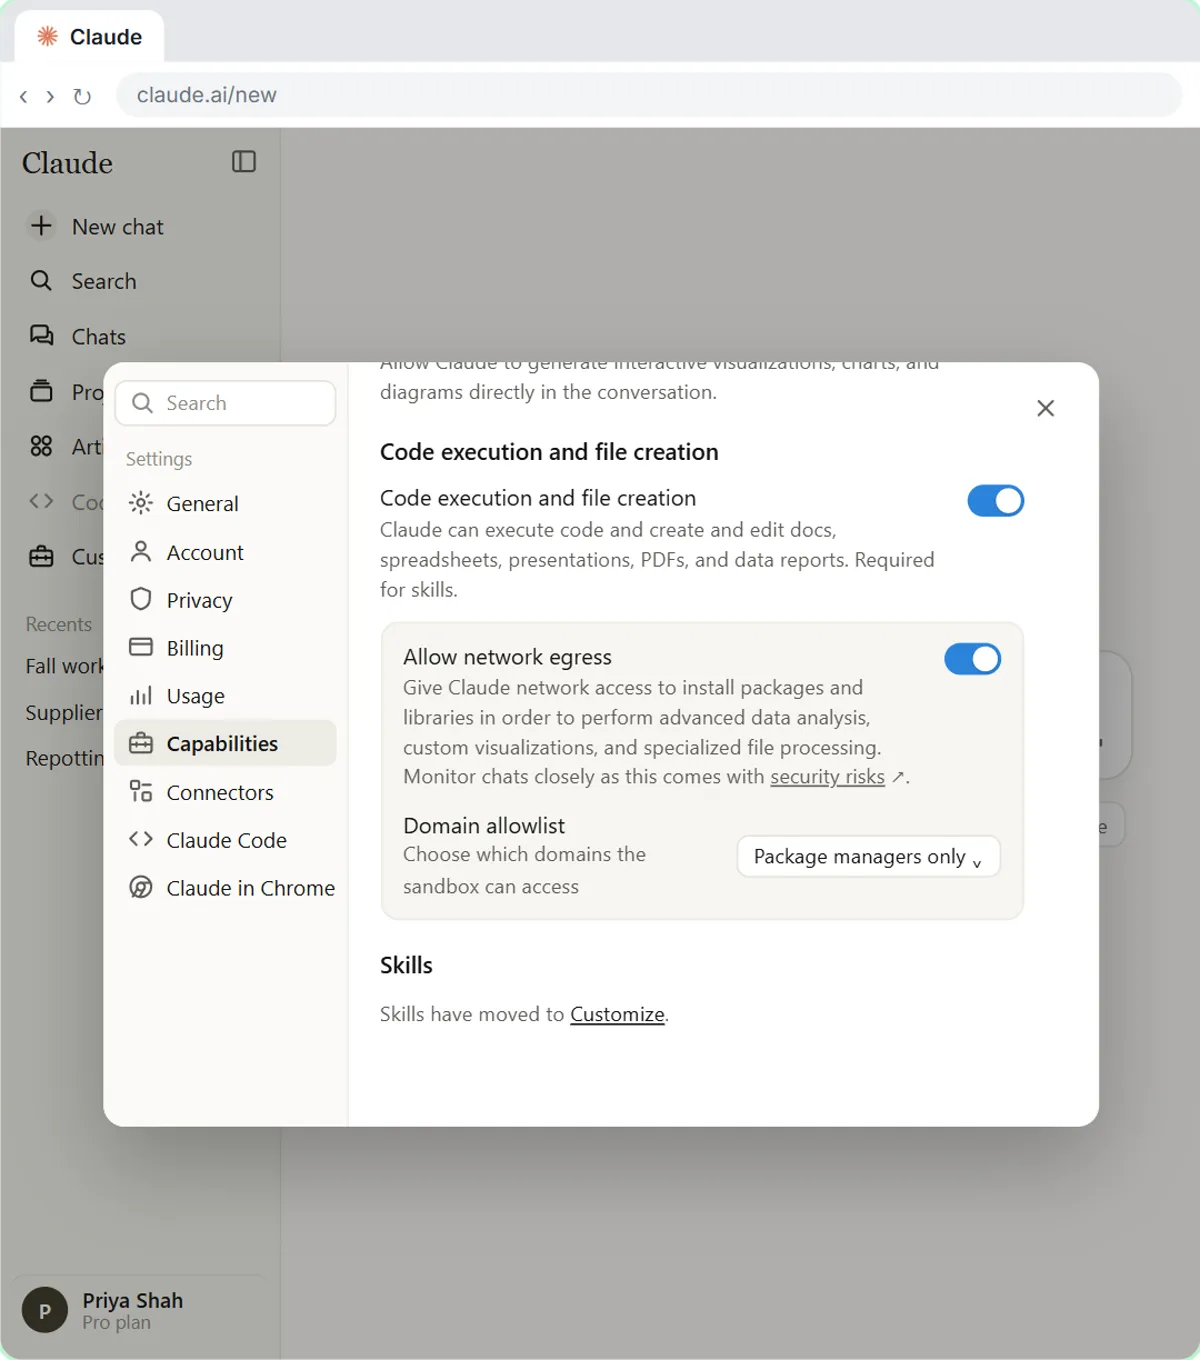
The skill is called xlsx, and it's one of the Claude skills Anthropic builds in. You don't install it. It needs one setting: Code execution and file creation, under your account menu, Settings, Capabilities. Claude then loads the skill by itself whenever you ask for a spreadsheet.
1. How do you clean a messy export into a Data tab?
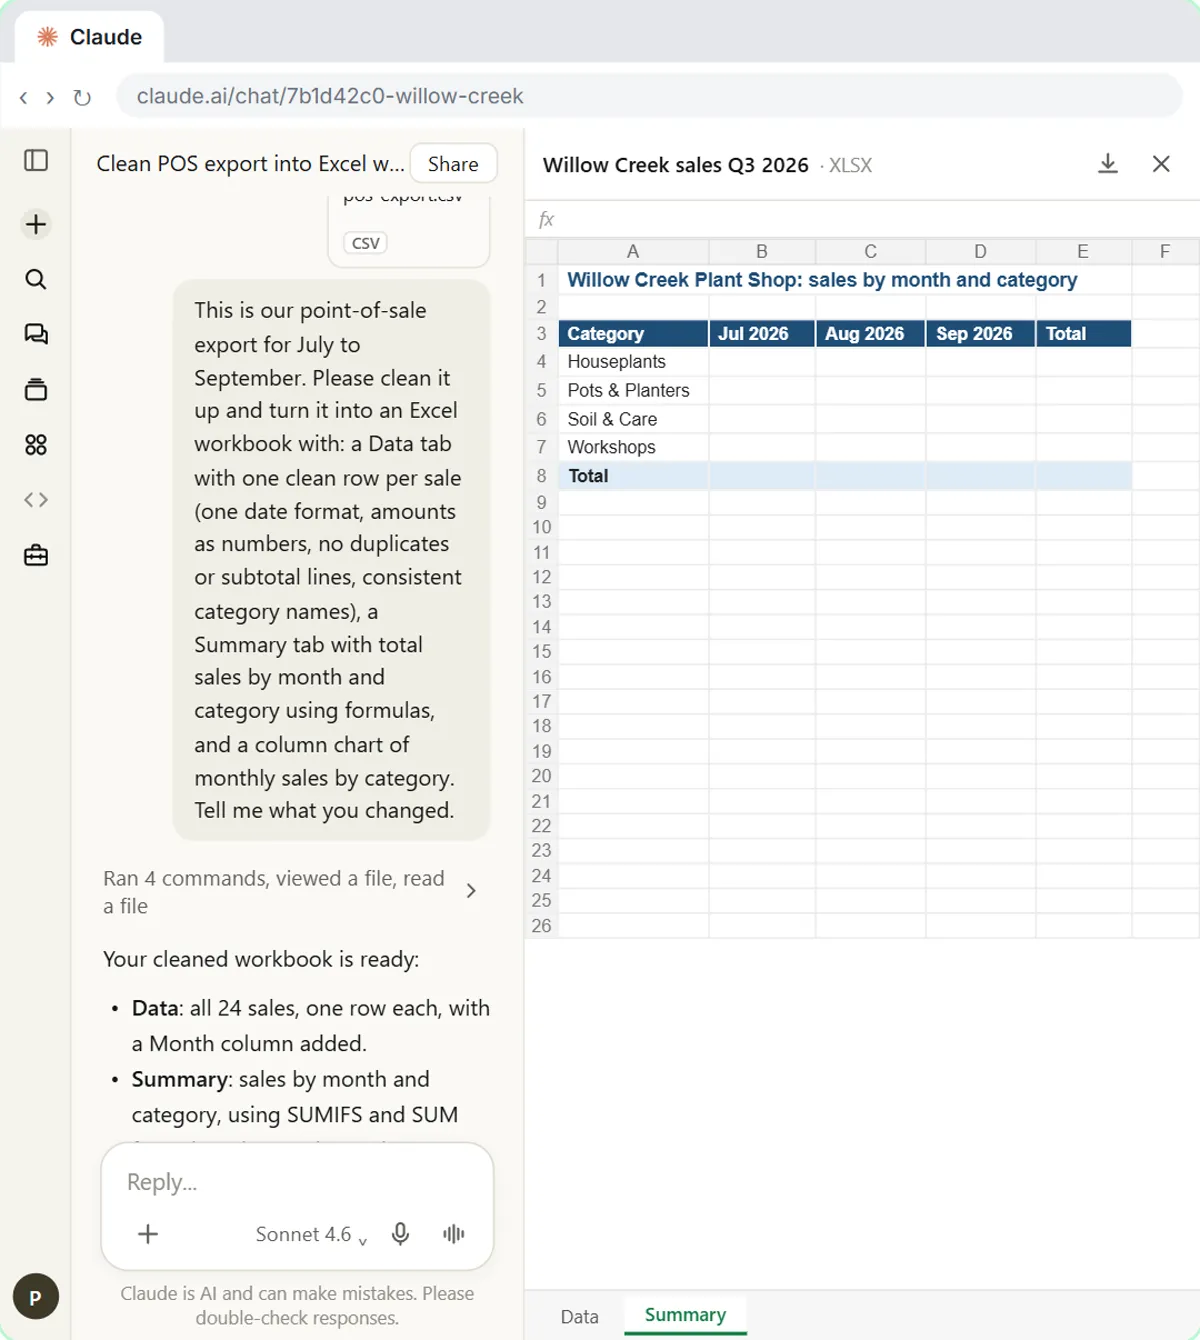
Upload the CSV and say exactly what "clean" means. In the lesson, the export has two title lines above the headers, dates in three formats, dollar signs, a subtotal line, a repeated row and "house plants" spelled three ways. That's a familiar sight for anyone who pulls data from a till, a billing system or an ERP.
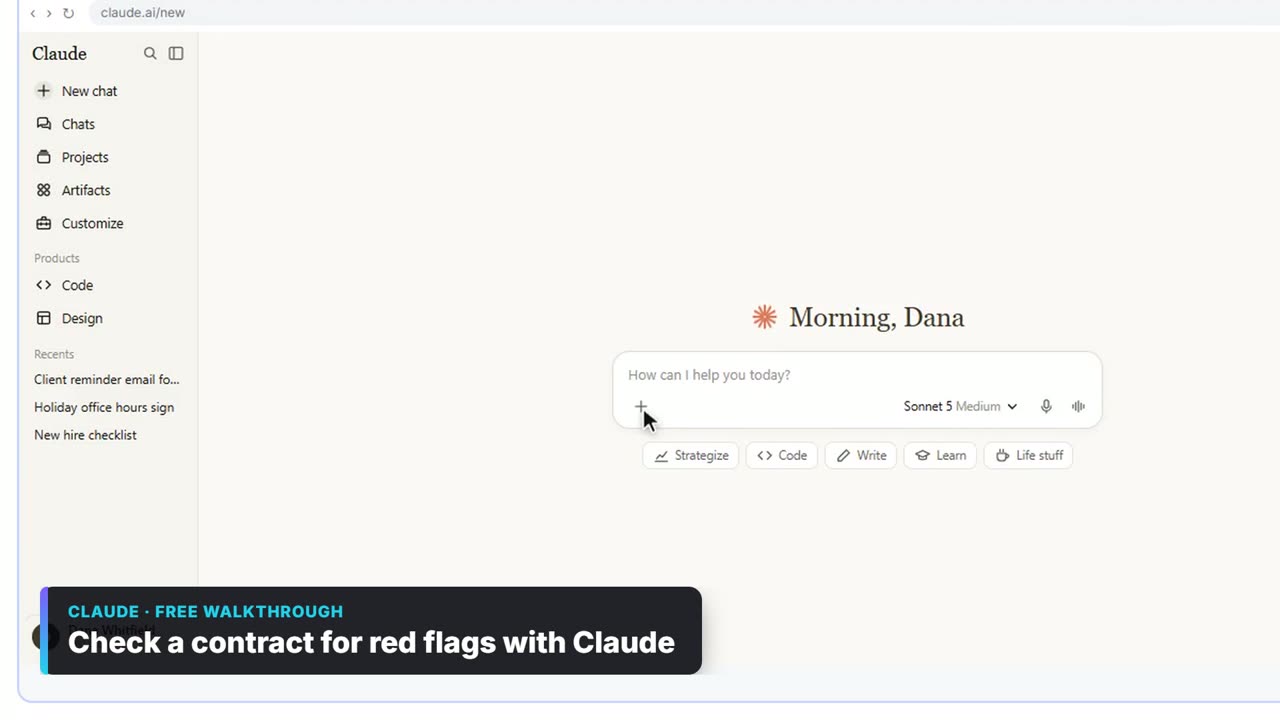
Click the + in the message box, then Upload or add files, pick the file and send a request like this:
This is our [SYSTEM] export for [PERIOD]. Clean it up and turn it into an Excel workbook with a Data tab: one clean row per transaction, one date format, amounts as numbers, no duplicates or subtotal lines, and consistent category names. Tell me what you changed.
What to check: the row count. The lesson's clean Data tab has all 24 sales and a new Month column. If your source system shows a record count, the two should match once you account for what Claude removed.
2. How do you build a summary that's auditable?
Ask for formulas by name. The lesson's request asks for "a Summary tab with total sales by month and category using formulas", and the Excel skill's rule is working formulas, not typed-in numbers.
Add a Summary tab with total [MEASURE] by [ROW DIMENSION] and [COLUMN DIMENSION], using SUMIFS formulas that point at the Data tab, with SUM totals for each row and column.
What to check: click a few cells in Excel and read the formula bar. In the lesson, cell B4 (July's Houseplants total) shows a SUMIFS formula that adds up the Data tab by category and month, and the grand total in E8 is a SUM. Because nothing is typed in, fixing a transaction on the Data tab updates the summary and the chart by themselves. That's the difference between a number you can trace and one you have to trust.
3. How do you add a chart without building it by hand?
Put the chart in the same request, so it's built from the summary.
Add a column chart of monthly [MEASURE] by [CATEGORY], built from the Summary tab, with a clear title and axis labels.
What to check: that the chart reads from the formula cells, not from a pasted copy of the numbers. In Claude's preview, the chart sits on its own Charts tab at the top. In Excel, change one sale on the Data tab and watch the bar move.
Try it free, step by step
Claude's Excel Skill: Turn a Messy Export into a Clean Workbook. Upload a messy sales export to Claude and get back a clean Excel workbook with a Data tab, a Summary tab built with formulas, and a chart, thanks to Claude's built-in Excel skill. You do every step yourself in a practice copy of Claude, it checks your work as you go, and “Do it for me” finishes any step you get stuck on. Free, and nothing touches your real accounts.
Start the free lesson4. How do you check what Claude removed?
Always ask "Tell me what you changed", then read the answer like a reviewer would. In the lesson, Claude reports that it skipped the two title lines, put every date in one format, turned text amounts into numbers, merged the category spellings into Houseplants, and removed 3 subtotal lines and 2 duplicate rows (orders 1047 and 1068).
List every row you removed, with its order number, date and amount, and say why. For each duplicate, tell me what made you treat it as a duplicate.
What to check: each removed duplicate. Claude flags them itself: each had the same order number, date and amount, but if either was a real second sale, you tell Claude and it puts it back. Then tie out one period to the source. The raw export's own July subtotal line reads $900.75, so the clean July total should match it. Checking the result against the source this way is source verification applied to numbers.
5. How do you highlight what matters each month?
Ask in plain words. The lesson's follow-up is one sentence:
On the Summary tab, highlight the top [CATEGORY] in each [PERIOD] in light green.
Claude adds a conditional formatting rule and makes an updated file. In the lesson's data, Workshops led in July and August, and Houseplants led in September.
What to check: that it's a rule, not a fill applied by hand. A rule moves by itself when the numbers change. Download the new version, click Enable Editing when Excel opens it in Protected View, and confirm the highlight lands where you expect.
6. How do you make the monthly summary a skill of your own?
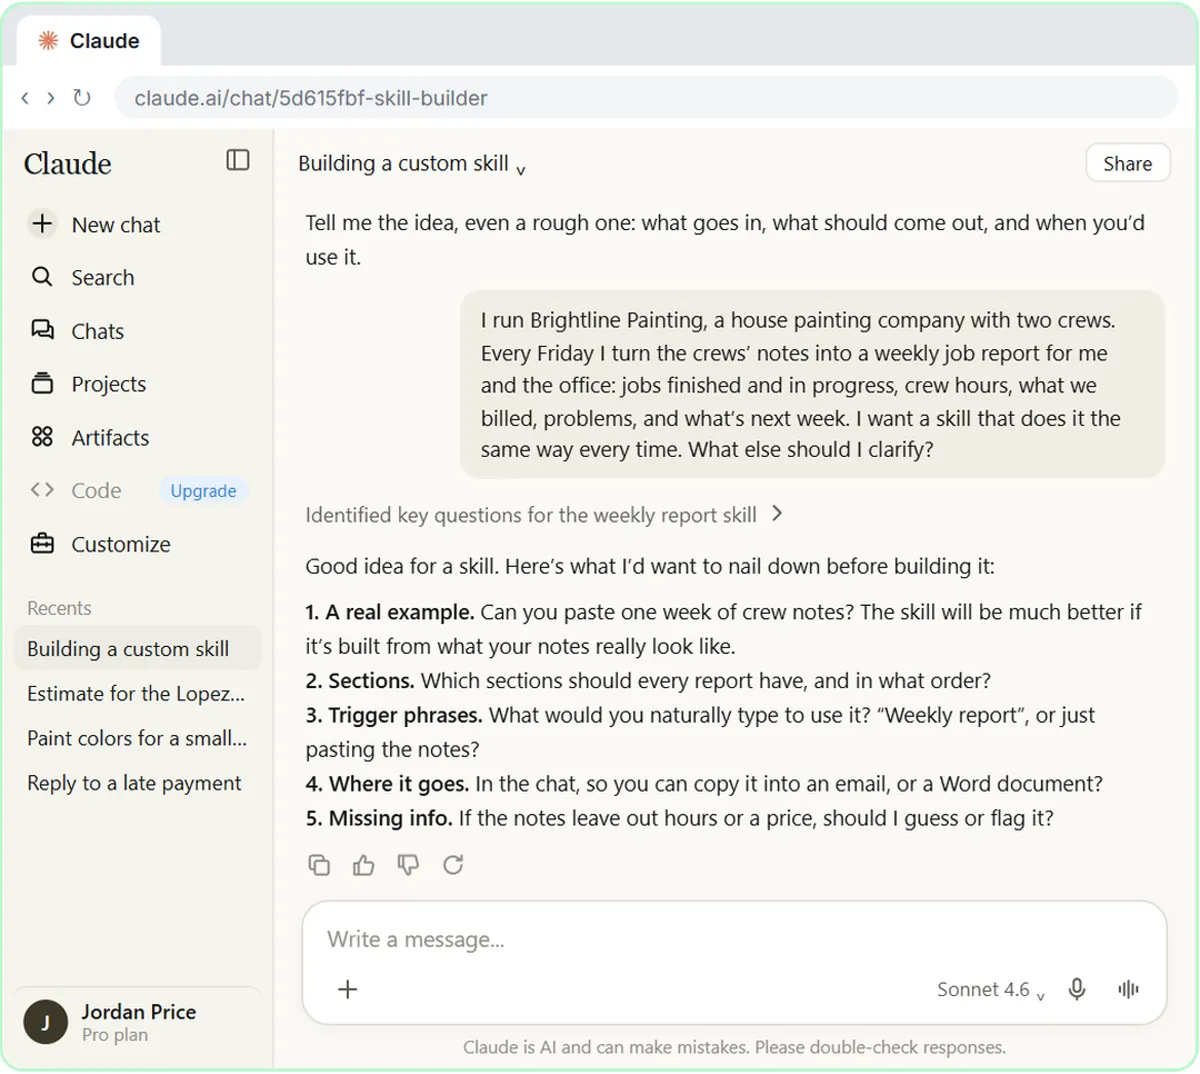
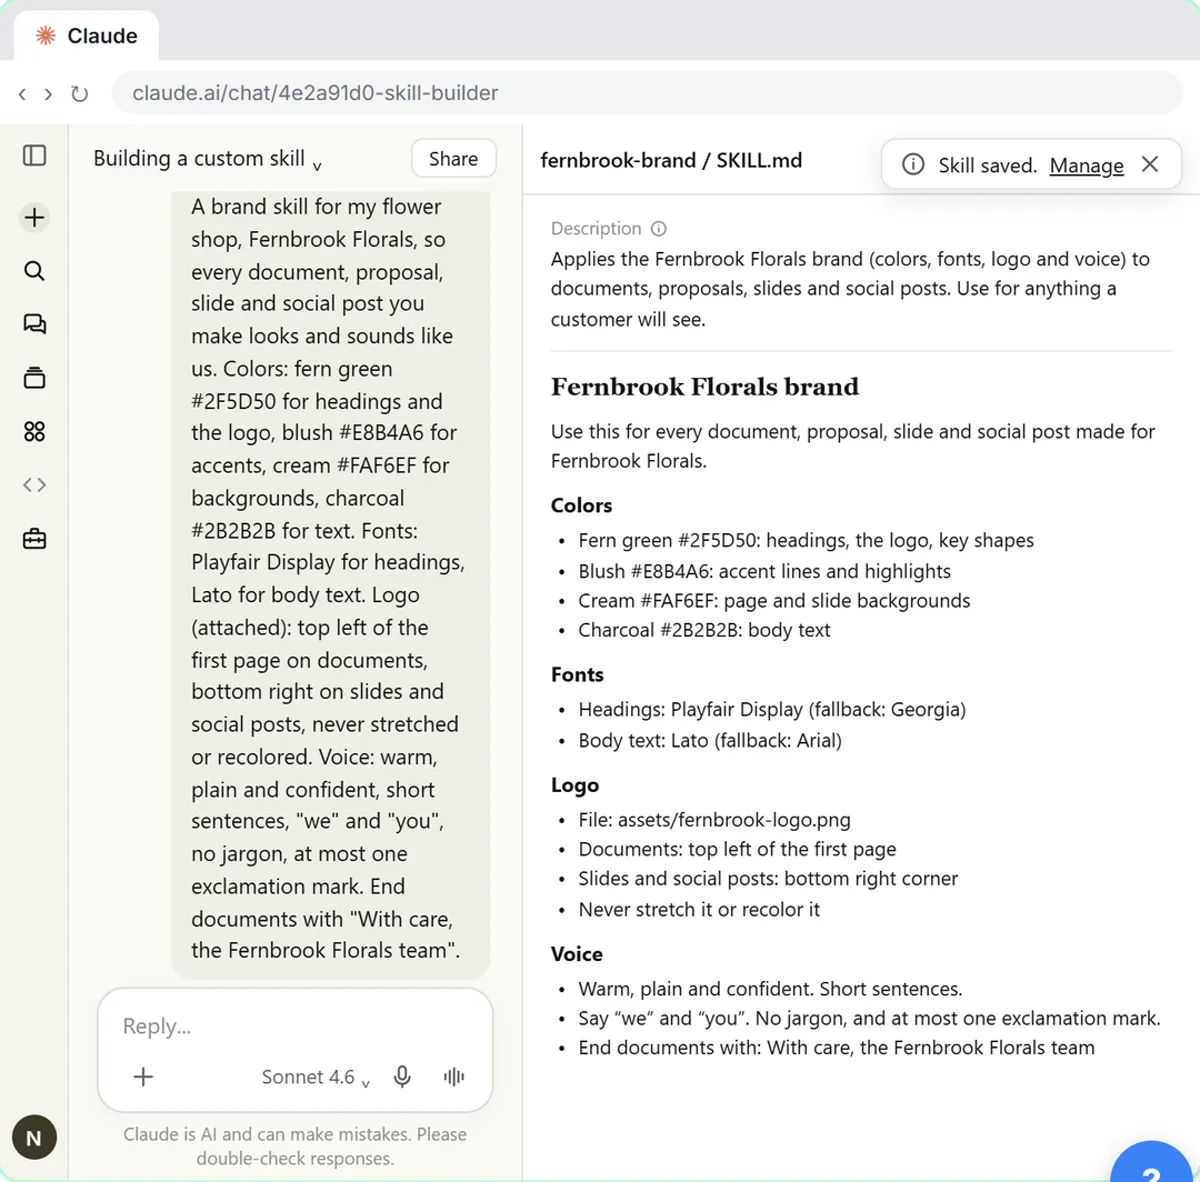
Once a cleanup and summary works, you'll want it the same way every month. The free Use case: build your own skill with the skill creator lesson shows how: in Customize, Skills, click + Add, then Create with Claude, describe the job, and answer the skill creator's questions. The lesson says the same approach works for "a monthly summary".
Every month-end I turn our [SYSTEM] export into a sales summary workbook: a Data tab, a Summary tab by month and category with SUMIFS formulas, a chart, and a list of every row removed. Never guess a missing amount or category: mark it [CHECK]. What else should I clarify?
What to check: test the draft skill on a real month's export before you save it, and read the description so it says when to use the skill, such as when an export is uploaded and a monthly summary is asked for. Keep it to one job. A cleanup skill and a board-pack skill are easier to fix apart.
Where should a financial analyst start?
Start with the lesson, then try it on one of your own exports. Use case: messy export to clean Excel workbook takes about eight minutes in a practice copy of Claude and Excel, so nothing is uploaded anywhere. It's module 6 of the free Claude Skills course and module 9 of AI for Finance Teams.
For your first real file, pick a low-stakes export you already know well, so you can spot a wrong total. Take out customer names and account details the summary doesn't need, and follow your company's rules on what data can go into an AI tool. The pivot table glossary page is a useful comparison if your team usually summarizes this way.
This page is about building workbooks, not about accounting treatment or financial advice. Have a qualified finance professional review any figures before they go into reporting, a forecast or a decision.
Key takeaways
- Claude's built-in xlsx skill builds real workbooks once Code execution and file creation is on.
- Spell out what clean means, and ask for SUMIFS formulas so every total can be traced.
- Always ask Claude what it changed, and check each removed duplicate yourself.
- Tie one period back to the source before you share the file.
- When the cleanup works, turn it into your own skill with a [CHECK] rule for gaps.
Frequently asked questions
- Do I need to install the Excel skill?
No. The lesson says the Excel skill is built in, so there's nothing more to switch on once Code execution and file creation is on.
- Will Claude's totals update if I fix a number?
In the lesson, yes: the Summary uses SUMIFS and SUM formulas, so fixing a sale on the Data tab updates the totals and the chart.
- Can Claude delete a real transaction by mistake?
It can treat a real second sale as a duplicate. That's why the lesson's reply lists the two removed orders and asks you to say if either was real.
- Is Willow Creek Plant Shop real?
No. Willow Creek Plant Shop, Priya Shah and the sales data are made up for the lesson.