Why this matters
Every Monday an operations manager rebuilds the same report: planned vs shipped orders by warehouse, a variance column, the bad weeks highlighted and a chart for the leadership call. Done by hand it takes an hour, and it breaks quietly when a warehouse or a week is added.
Elyx is an AI agent that works inside Excel. You describe the report in plain words and it builds it in the open workbook with real formulas, so you can check every number and reuse the report next week. In our test every total was right, and one sentence of its summary was not, so this lesson builds in the check.
Practice
Do every step yourself in a practice copy of the real tool. It checks your work, and “Do it for me” finishes any step you get stuck on.
What you’ll build
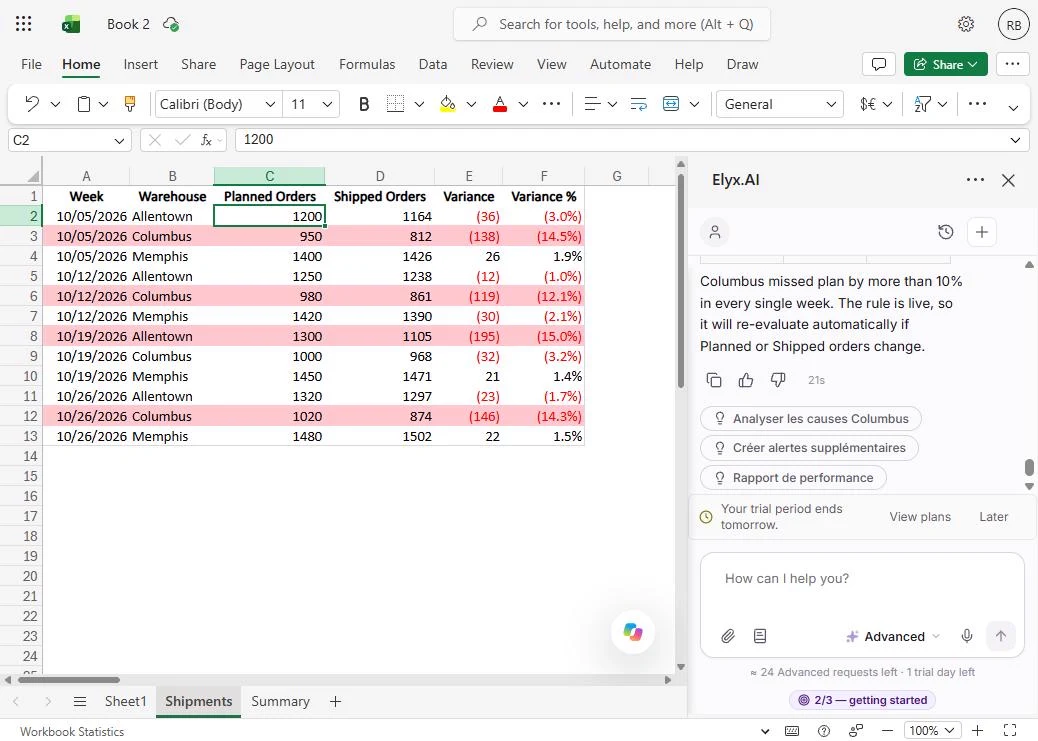
You run operations for a made-up company with three warehouses. In three requests, Elyx adds Variance and Variance % columns, a Summary sheet of SUMIFS formulas, a red rule for weeks more than 10% under plan, a chart and a PivotTable.
Then you change one number and watch the report update by itself. The screens are real screenshots from my own Excel for the web and Elyx trial, captured November 2026.
What you need
- Nothing to start the practiceThe lesson is a practice copy. The company and its numbers are made up.
- Excel and the Elyx add-in, to do it for realElyx runs in Excel for the web, Excel 2021+ and Microsoft 365 on Windows and Mac. Install it from Add-ins on the Home tab. It has a 7-day free trial with no card; check the current plans.
- The made-up shipments sheetThe download link is in the steps for doing it for real. Use it or a copy of your own sheet, not the live file, while you try it.
Concepts
Ask for formulas, not answers
We asked for the Summary "using SUMIFS formulas that point back to Shipments". Elyx wrote =SUMIFS(Shipments!$C$2:$C$13, Shipments!$B$2:$B$13, $B3) and the same for every cell, so the numbers are live.
That is what makes it a report and not a one-off answer: change a row and the totals and chart follow. Click one cell and read the formula bar before you trust it.
The sheet is right, the summary can be wrong
The red rule was exactly right: four rows past -10%. But Elyx's reply said Columbus missed plan by more than 10% "in every single week". Columbus was -3.2% on 19 October.
AI tools that change your workbook also describe what they did, and the description is the part to double-check. Repeat what the cells say, not what the chat says.
Spend requests on building, not on running
The lesson uses three Advanced requests. After that, the report is formulas, a conditional formatting rule, a chart and a PivotTable, so next week costs nothing: paste the new rows and refresh the PivotTable.
In our test the formulas and chart updated by themselves when we changed a number. The PivotTable needs Data > Refresh, like any PivotTable.
Do it for real
Now repeat it in your own account. Tick each step as you go.
Downloads
- Made-up shipments sheet (CSV)Northline Fulfillment: four weeks of planned vs shipped orders for three made-up warehouses.
Quick check
3 questions to check you’ve got it.
1. Why ask Elyx to use SUMIFS formulas for the Summary?
- So the totals update when the data changes, and you can check them
- Because Elyx cannot type numbers
- To make the file smaller
Show the answer
So the totals update when the data changes, and you can check them. Formulas keep the report live and auditable. When we changed one shipped number, the Summary and chart updated by themselves.
2. The red rule is right, but Elyx says Columbus missed every week by more than 10%. What do you do?
- Trust the cells and correct the claim before repeating it
- Repeat it in the meeting
- Delete the rule
Show the answer
Trust the cells and correct the claim before repeating it. Columbus was -3.2% on 19 October. The workbook changes were correct; the sentence describing them was not.
3. You paste next week's numbers in. What do you still need to do?
- Refresh the PivotTable
- Send three new Elyx requests
- Rebuild the chart
Show the answer
Refresh the PivotTable. The formulas, rule and chart update by themselves. A PivotTable only updates when you refresh it.